INKISH.TV Proudly Presents: Who Makes Money in the Value Chain
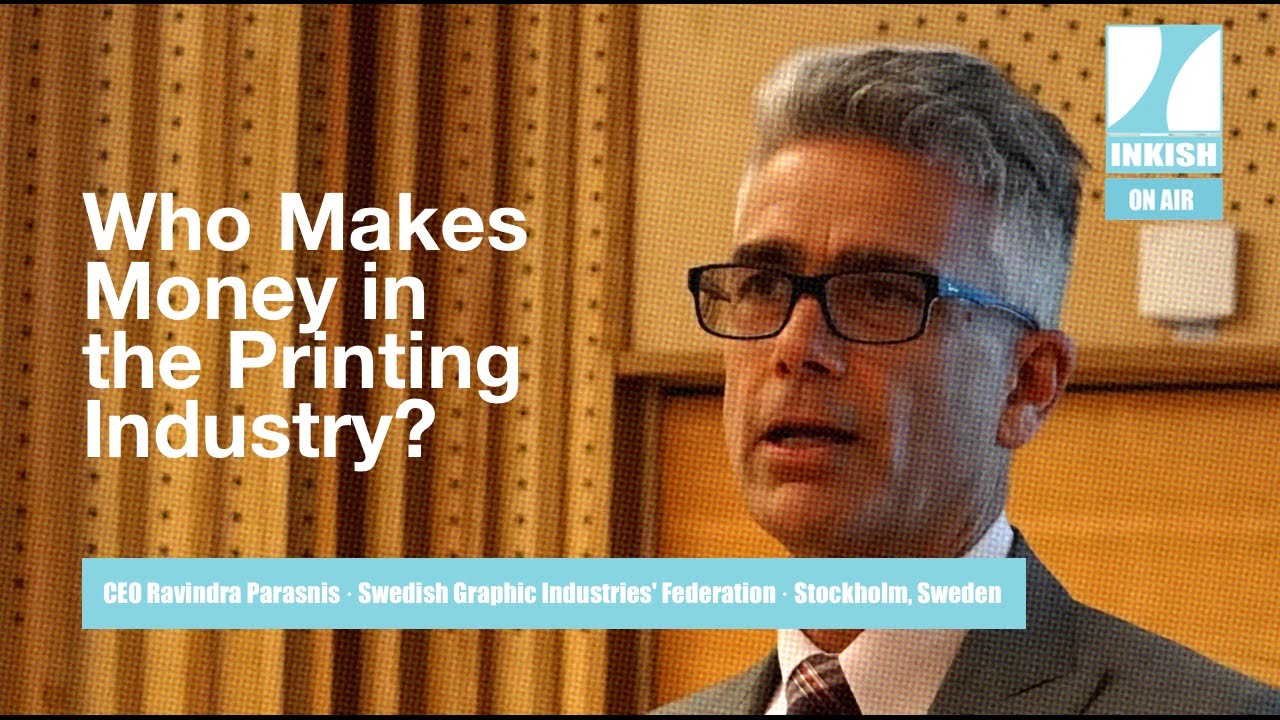
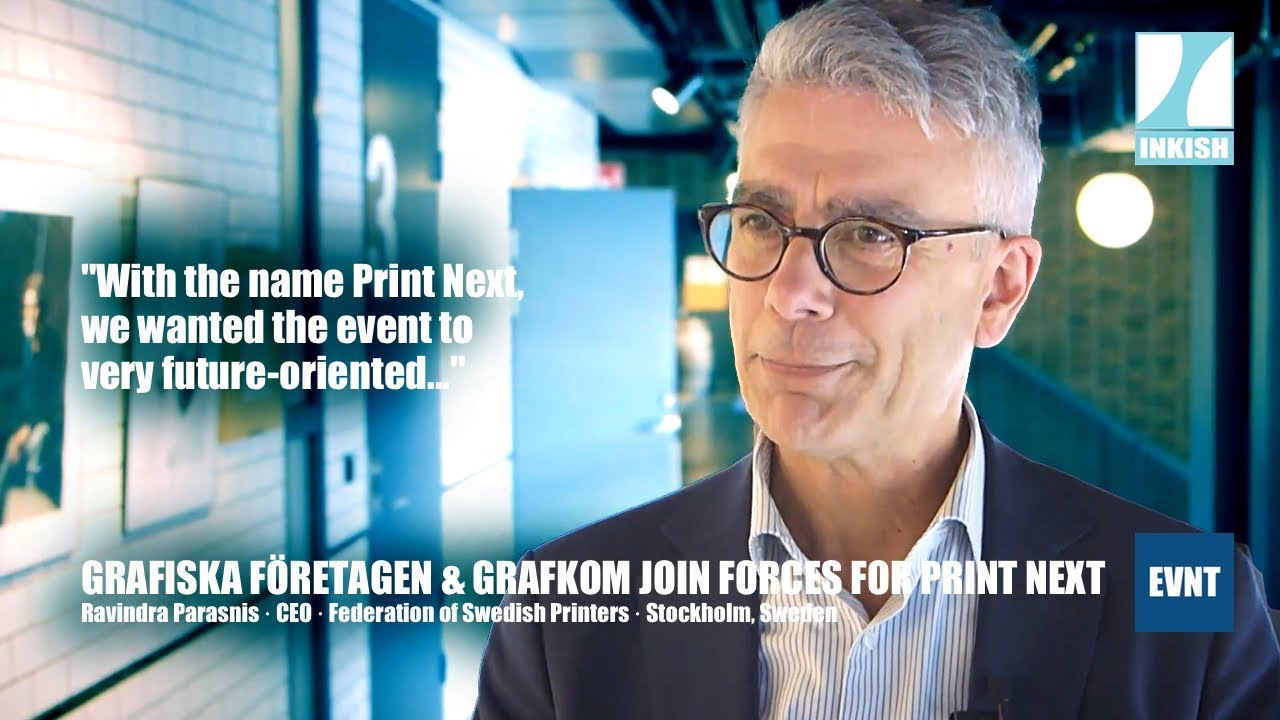
CEO Ravindra Parasnis from Swedish Graphic Companies’ Federation have together with Bisnode made a comprehensive survey about who makes money in the printing industry. This episode gives you a lot of answers and interesting views, that can help you, inspire you and make your business stronger and better.
0:23 Grafisk dag is an event arranged by Grafiska Fˆretagen in Sweden, the Printing Federation in Sweden, and I was invited to participate with all the other people from the industry and it was a great network event. A lot of more businesses, like this year was the best Grafisk dag for many years, I think. More knowledge and more networking, and more deep information about how the industry develops.
1:03 It was really about looking at the value chain at the graphic industry in order to see who is over a longer period of time. We looked at some, close to 2,000 companies, how they have performed over the last seven years, and this was in order to see who in the value chain makes money, and who is not making money. Thereís a lot of opinions about how the graphic industry is doing compared to other businesses and so on, and we wanted to have a fact-based survey, a view to see how is it really going, how are we actually performing versus other areas in the industry.
1:43 Of course, we were heavily involved ourselves, since we basically know all companies, so we could both select and deselect what companies should be part of this service, but of course we used also an external consulting company called Bisnode, that are specializing in analyzing huge amount of data, because this was a huge undertaking.
2:07 We met Grafiska Fˆretagen some time ago. They have an interest in understanding this structural changes in the graphical industry. We have all the data and the knowledge to actually analyze that, so their needs are very much what we can deliver. So, weíve started a project to see what is happening in the graphical industry in Sweden.
2:31 Having a fact-based survey was one, but obviously also in order to help companies in their strategic thinking and also have this as an input for their own, for the individual companies own strategy.
2:49 Bisnode has developed a method or a model called ëThe simpler modelí, and that allows you to compare the efficiency of a company, whether they are big or small it doesnít matter, because the model as such takes that into account, so you get an even comparison.
3:06 Basically, our method is measuring not only the growth and development of the industry, we also measure the competitiveness, and we base all of this on the added value in the company, and we work very closely with Grafiska Fˆretagen to actually define the industry. They know their businesses, we know the facts and figures, so they can help us define the business, they know how business works, and our knowledge combined gives a very, very good result.
3:40 When we look at the competitiveness, the method we use is called ëSimplerí, and we base that on the cost of making your added value in your industry. So basically, if you make your added value at the same cost as the business in total in the country, you are as competitive as the country is. If you have a lower cost to make your added value, you are more competitive. We use this and look at different segments of the graphical industry, which has been very interesting, because when you take added value instead of a turnover, you can actually add a value chain without doubling up. Turnover will always increase, whereas the added value is unique for each part in the value chain.
4:19 If you look at the added value and the cost to create added value, we do the labor cost, we also do the marketing cost of capital when we look at the cost to create your value. It doesnít matter if you are a small company, a big company, if you are a refinery with a lot of capital, or if you are a consultancy company with most people in ñ you can compare all of these and you compare them to sort of the average of all businesses in Sweden.
4:55 There were numerous conclusions, but one of them is clearly so that looking at the value chain, you can see that the traditional, the commercial printers, meaning offset, small digital format, have been extremely good in these challenging times to keep their competitiveness by some really slashing employees, by being more efficient. However, it is also clear that thatís not how you can grow in the future. We could also see that those companies specializing, for instance large format, or having some special printing part, are performing clearly better than the average. And in large formats you have a huge growth over the past seven years.
5:45 The period is starting before the recession and goes over recession until now, and you can say that lot of the businesses are affected by the recession a lot, so most of the businesses actually recovered quite well from the recession in couple of years afterwards. I donít think that the recession is the problem for the graphical industry, itís more of a long-term issue. The digitalization is happening and you would say, the graphical industry has been going down sort of steadily all over these years, the sub-segments, especially overall printing of books and magazines.
6:25 Itís very interesting to see the results and which kind of companies develop the best, and which ones did not develop that good.
6:33 Division within the industry was very interesting, because it comprises both, companies with a very good position and sub-segments that have really been struggling and are also affected by the change by the digital era. Packaging will always be sold, at least at the moment, whereas books and newspapers are not as bought as much anymore.
6:56 There were some parts that were surprising, because we did compare the graphic industry also with other types of industry, that have been very challenging over the past. Basically, in all other industry segments in Sweden, the number of companies have been growing, meaning that even though the overall business might be going down, we see start-ups, we see small companies, 1,2,3,4 employee companies growing, and thatís where the graphic industry is completely different, because number of companies is constantly going down, even for small companies.
7:37 What I saw, which was not surprising, but very interesting, was that the brokers or the companies that are buying print, helping companies to buy print, were the best performers.
8:07 We looked at areas within the graphic industry that are doing clearly better, the packaging industry is doing better than the average, also labels are doing clearly better having a quite good performance over the past seven years. When we look at the value chain, it can be quite clearly seen that the creation of the message, meaning PR and communication bureaus, they are growing and they are also making better money than the average in the industry.
8:47 If you look at the traditional printing of magazines and books ñ itís a shrinking business, and they do stay competitive and control their costs, but itís shrinking time each year. If you look at the packaging industry, thatís a different thing ñ itís a growing business, a good business, and itís a very big difference within the graphical industry what segment you are in, and thatís a tough challenge for the industry and also for Grafiska Fˆretagen to see what to do.
9:20 No, you canít do that. What you can look at is maybe we should change the way we do business in part of the value chain, or maybe you redefine your business proposition to the market, and you can look at some of the small companies still, but companies that are providing a storytelling through your mobile telephones and they are doubling their turnover every year. So, there is a big change in the market and you would say: ìWould I like to be part of a channel that is selling something, rather than having just printed matter?î So, thereís a lot of questions they can work on.
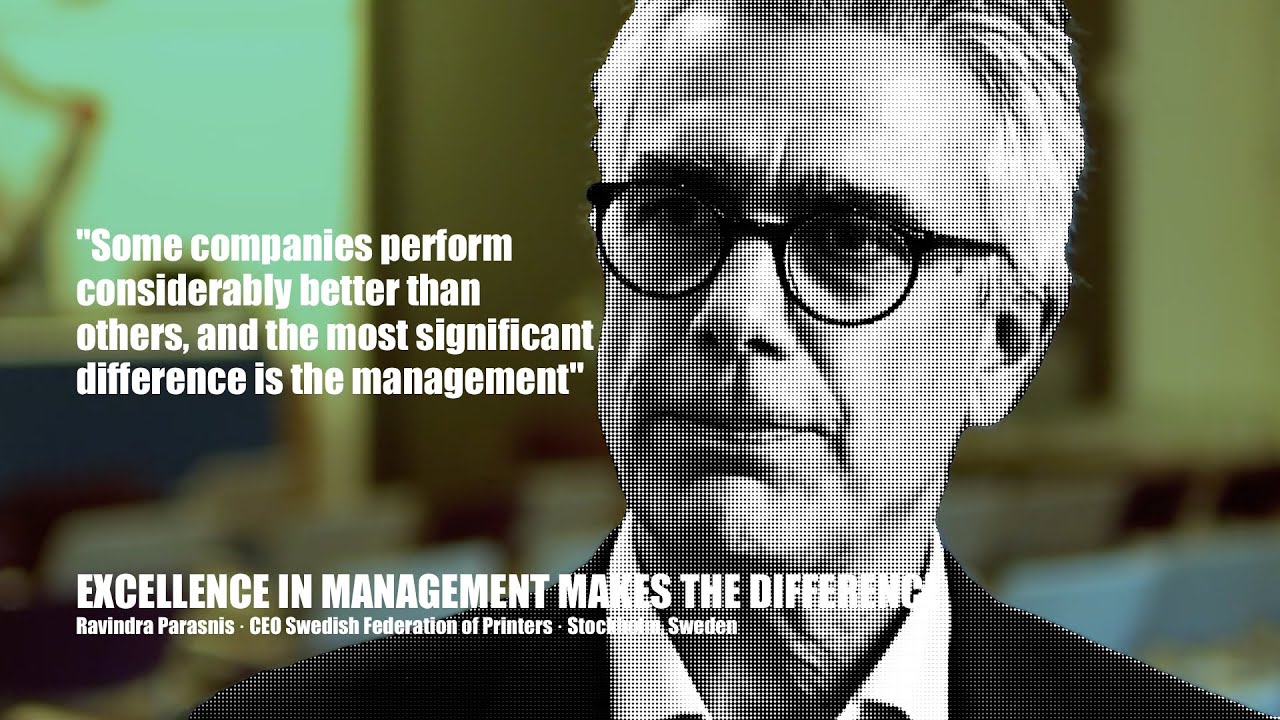
10:00 In all industries, there are good company leaders and bad company leaders, and those who listen and those who look at reports and do their business intelligence. If you do that, you can develop your company and take the next necessary steps to survive, but if you donít, you will be passed away from the industry, but that also makes room for new actors, new companies coming in to the industry.
10:43 What we have helped the Grafiska Fˆretagen also is to look at who are the high performers in the different sub-segments, and they can say: ìThese are our Top 20 companies. What are they doing compared to the other ones that are not performing as well?î, and thatís a direct knowledge we get together, you talk to the companies and Grafiska Fˆretagen can interview these companies to understand if they have changed the way of doing business.
11:13 My hypothesis when we started was that we would see that the Top 20 performing companies, would come from a specific area of the graphic industry. That was not some, you can see that the top performers are from all parts of the graphic industry and what sets them apart, I would say is an extreme service orientation, extreme customer focus and they are also very clear on what business they donít do.
11:52 The Swedish printing industry is absolutely ready to absorb it, but they need to spend a bit more time to read the reports, look at the results and I think, more companies need to put more time on doing that.
12:13 The service generated a lot of interest among individual companies. We have had numerous companies that have asked for a full serving, weíve had a lot of discussions with individual companies that want to know more. Also, of course challenging some parts saying that: ìI want to know exactly what companies are within this groupî, and so on, and since this is official data from physical data that you send in every year, thereís no hocus-pocus in this. I think itís great that so many companies show this interest, because I mean, that was my hope that this can be one piece in the puzzle when you build your own strategy for the future.
13:03 I think itís very much up to them. You can say that the printers have been doing a good job looking at the data, because they are still competitive although itís a shrinking business. You could say that combining our knowledge with the global trend and so, they can maybe change the businesses, or they can look, as Iíve said before, who are the winners in the market. And sometimes itís good just to know that all of the companies in the business are performing in a certain way, so you know if you continue to be in this business, you will not grow your company unless you buy the other ones on the market to go. So, you can actually base a strategy on that.
13:44 I think what the service suggests and when you analyze the numbers and you think a little bit about what should I do as individual company, I think itís quite clear that you have to create more value-added services and you have to be a complete communication solution provider. The way to do it is I donít think itís necessary that you go out and try to buy your competitors or other parts of the business, but I think that the industry and as an individual company, you have to look for strategic alliances, for partnerships with other companies in the value chain in order to provide the end-customer with a complete solution.
14:31 I think the industry needs to use a lot more external consultants to develop their business. The printing industry is trying to do a lot of things themselves and we need to bring in more consultants, more fresh ideas from the outside, both from the customersí point of view and from business consultantsí point of view, because you always are so into your own company and daily work of your company, and the leaders in the printing industry are very close to the production and close to sales, and donít spend enough time on business development.
15:16 Absolutely not ñ for all sizes, even if you are 2 or 3 or 4 men company, you can bring in consultants and you can read reports. I mean, there are lots of reports to buy and you need to do that, as well.
15:38 Myself around Branschkoll, which does this. Thatís the only thing we do, we help the industry to find the right pieces of information and do the analysis and help them take the next steps. We also have networks like Grafiska and Grafkom, which Iím involved with a lot, and thatís also what you need to do, put time on that kind of activities.
16:16 No, we have not done this type of survey for the graphical industry in other countries. We have done other types of analysis in Norway and Germany so far, and weíve been lucky that weíve been in Sweden, which is a very open country when it comes to data, but itís applicable internationally, as well, and we are operating in many countries in Europe this now, so we look forward to doing more interesting work in other countries.
16:45 I would guess so, and that is based on my discussions with Grafiska Fˆretagen and the people and companies Iíve met during this work. And also, if you look at my colleagues that are younger, they donít have a newspaper subscription, I do have still, so itís probably a worldwide trend.
17:08 We are learning from this project a lot and also we already have online offers from Bisnode that actually you can look at all of the data, but the way weíre collecting data using ëThe simplerí method hasnít been offered online yet. That is something that we are looking at the possibility to do both for different regions of Sweden, as the branch organizations like Grafiska.
17:34 We will do some kind of a follow-up and hopefully, as Iíve said, this took a lot of hands on the job. I want to find a smoother solution so we can make an update every year, without having to put so much time as we did the first time, but clearly I hope for it and youíll follow up to all the time monitoring how the industry is evolving and what parts of the value chain are doing better than the others.


